
Portfolio Console — Live
SYS_TIME: 06:00:00OPERATOR: BIOMED_ADMIN
Coverage Intelligence
Every asset.
Every risk.
One policy.
Underwriting for MRI suites, surgical robotics, and linear accelerators — breakdown, obsolescence, and regulatory recall unified.
Annualized Savings — Portfolio AvgVerified
$0
vs. OEM service contract stack · FY2025
Covered Assets
0/ 847 active
Asset IDEquipmentRiskStatus
MRI-0041
MRIMemorial Health
12
SRG-0187
Surgical RobotNorthshore Regional
8
LNA-0033
Linear AcceleratorPacific Oncology
27
CT-0092
CT ScannerLakeside Imaging
5
MRI-0078
MRISt. Catharine
19
SRG-0204
Surgical RobotCascade Valley
44
Showing 6 of 847View all →
Coverage Map — US847 pins
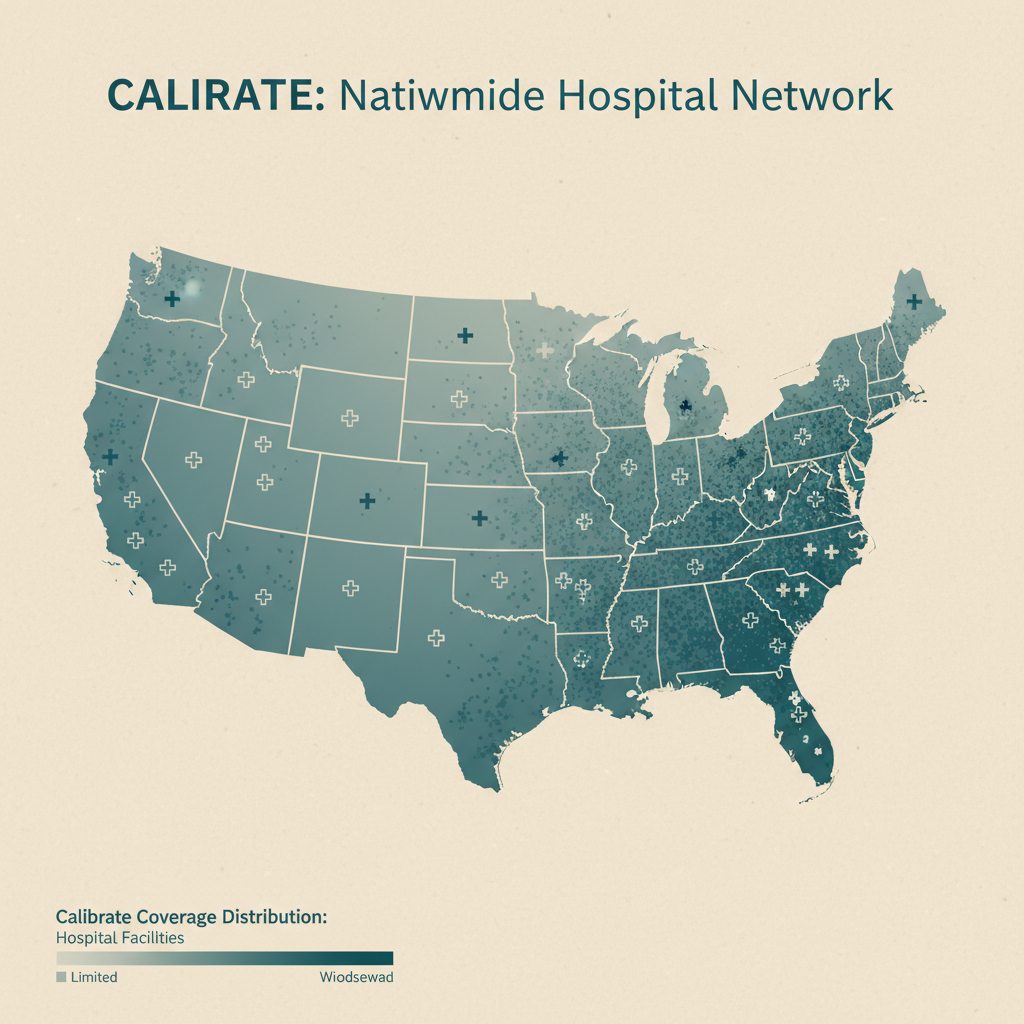
Active
Review
Portfolio by Facility Type
Hospital Systems412
Imaging Centers298
Oncology / Specialty137
214
Policies
99.7%
Avg Uptime
3
Open Claims
All systems nominal
LAST_SYNC:2026-02-26 06:43 UTC
COVERAGE_GAPS: 0RENEWALS_DUE: 7RECALLS_ACTIVE: 0
Assets Covered:847|
Avg Claim Turnaround:4.2 days|
Industry Benchmark:31 days|
Annualized Savings:$2.4M|
Policy Uptime SLA:99.7%|
Coverage Gap Incidents:0|
Equipment Classes:14|
Facilities Served:214|
Recall Events Covered:100%|
Avg Equipment Value:$3.1M|
Assets Covered:847|
Avg Claim Turnaround:4.2 days|
Industry Benchmark:31 days|
Annualized Savings:$2.4M|
Policy Uptime SLA:99.7%|
Coverage Gap Incidents:0|
Equipment Classes:14|
Facilities Served:214|
Recall Events Covered:100%|
Avg Equipment Value:$3.1M|
METRIC_01 — Claim Velocity
The gap between
resolution and revenue loss.
Every day a covered asset is offline, your facility bleeds revenue. The industry average OEM claim takes 31 days to close. Calibrate closes in 4.2.
Calibrate
4.2 daysAverage claim turnaround↓ 86% faster
OEM / Industry Avg
31 daysOEM service contract benchmark$12K–$65K lost/day
26.8
Days Saved
avg/claim
$321K
Revenue Protected
per incident
99.1%
Claims Resolved
within SLA
94
Biomedical Director NPS
100%
Recall Events Closed
<48hrs
Avg Policy Activation
$18.4M YTD
Obsolescence Claims Paid
METRIC_02 — Downtime Exposure Calculator
What does one
downed scanner
actually cost?
Select equipment class and incident frequency. Watch your annual exposure calculate in real time.
2
1 incident8 incidents
Class A Equipment
MRI Suite (3T)
Revenue/Hour
$1,800
Avg Downtime
4.1 days
Total Annual Exposure — Uninsured
$0
2 incidents × 4.1 avg days × MRI Suite (3T)
Revenue Lost
$0
196 hrs × $1,800/hr
Repair / Parts
$0
2× avg OEM repair cost
Calibrate Policy Cost
Estimated Annual Premium
Policy Premium
$0
Net Protection
$0
Coverage: breakdown + obsolescence + regulatory recallGet My Audit
METRIC_03 — Coverage Comparison
OEM contract stack
vs. a
unified policy.
Most facilities run 4–7 separate OEM service contracts per equipment class. Calibrate replaces the stack with one policy — at a fraction of the aggregate cost.
Avg Annual Savings
$273K
vs. comparable OEM contract stack
Coverage Feature
OEM Contract
Calibrate
Delta
Equipment Breakdown CoverageCore
—
Parts & Labor (OEM rates)Core
$285K avg
Full coverage
+$285K
Regulatory Recall EventsCompliance
Included
Technological ObsolescenceCompliance
Included
Multi-vendor EquipmentScope
Single OEM only
All manufacturers
Unified
Business InterruptionFinancial
$12K–$65K/day
Claim Resolution TimeService
31 days avg
4.2 days avg
86% faster
Annual Policy CostFinancial
$420K avg stack
$147K bundled
$273K saved
Renewal ManagementService
Manual per device
Automated
40 hrs/yr saved
Risk Score DashboardAnalytics
Included
Biomedical Engineering SupportService
Extra cost
Included
$48K/yr
Annual Total
$420K avg
$147K
−$273K
CTA — Portfolio Audit Request
Request a
Portfolio Audit.
Our biomedical risk analysts review your equipment roster, current coverage, and identify every gap — free, within 48 hours.
The Downtime Cost Report
32-page analysis of equipment downtime across 214 US facilities. Build the internal case for your CFO.
What Happens After Audit
01
Equipment Roster Review
We map every covered asset against current OEM contracts and identify gaps
02
Risk Score Calculation
Each asset receives a risk score based on age, utilization, and recall history
03
Coverage Gap Report
Itemized PDF showing every uninsured exposure and its annual dollar value
04
Bundled Policy Quote
Single-policy quote covering all gaps, typically 30–65% below OEM stack cost
Client Reference
"Calibrate replaced our five OEM contracts with one policy and cut our annual spend by $318K. When our Varian went down in January, the claim closed in three days."
DH
Dr. David Harrington
Director of Biomedical Engineering · Pacific Oncology Center